


How to Calculate Quartiles for Ungrouped Data
Understanding data is crucial for making informed decisions. Quartiles divide data into four equal parts, providing insight into its distribution. Knowing how to calculate quartiles for ungrouped data helps in identifying patterns, detecting outliers, and summarizing datasets effectively. This guide will walk you through each step with clear explanations and examples.
What Are Quartiles?
Quartiles are values that split a dataset into four equal parts. Each part represents 25% of the data. The main quartiles include:
First Quartile (Q1)
Q1 marks the 25th percentile, meaning 25% of data points fall below it.
Second Quartile (Q2)
Also known as the median, Q2 divides the data into two equal halves at the 50th percentile.
Third Quartile (Q3)
Q3 is the 75th percentile, showing that 75% of data points fall below it.
Why Quartiles Are Important
Quartiles are useful for:
- Identifying the spread and central tendency of data
- Detecting outliers through interquartile range (IQR)
- Comparing different datasets efficiently
Steps to Calculate Quartiles for Ungrouped Data
Calculating quartiles for ungrouped data follows a simple process. Ungrouped data refers to raw data points that are not arranged in intervals.
Arrange Data in Ascending Order
Sort the dataset from smallest to largest. Proper ordering ensures accurate quartile calculation.
Determine the Position of Quartiles
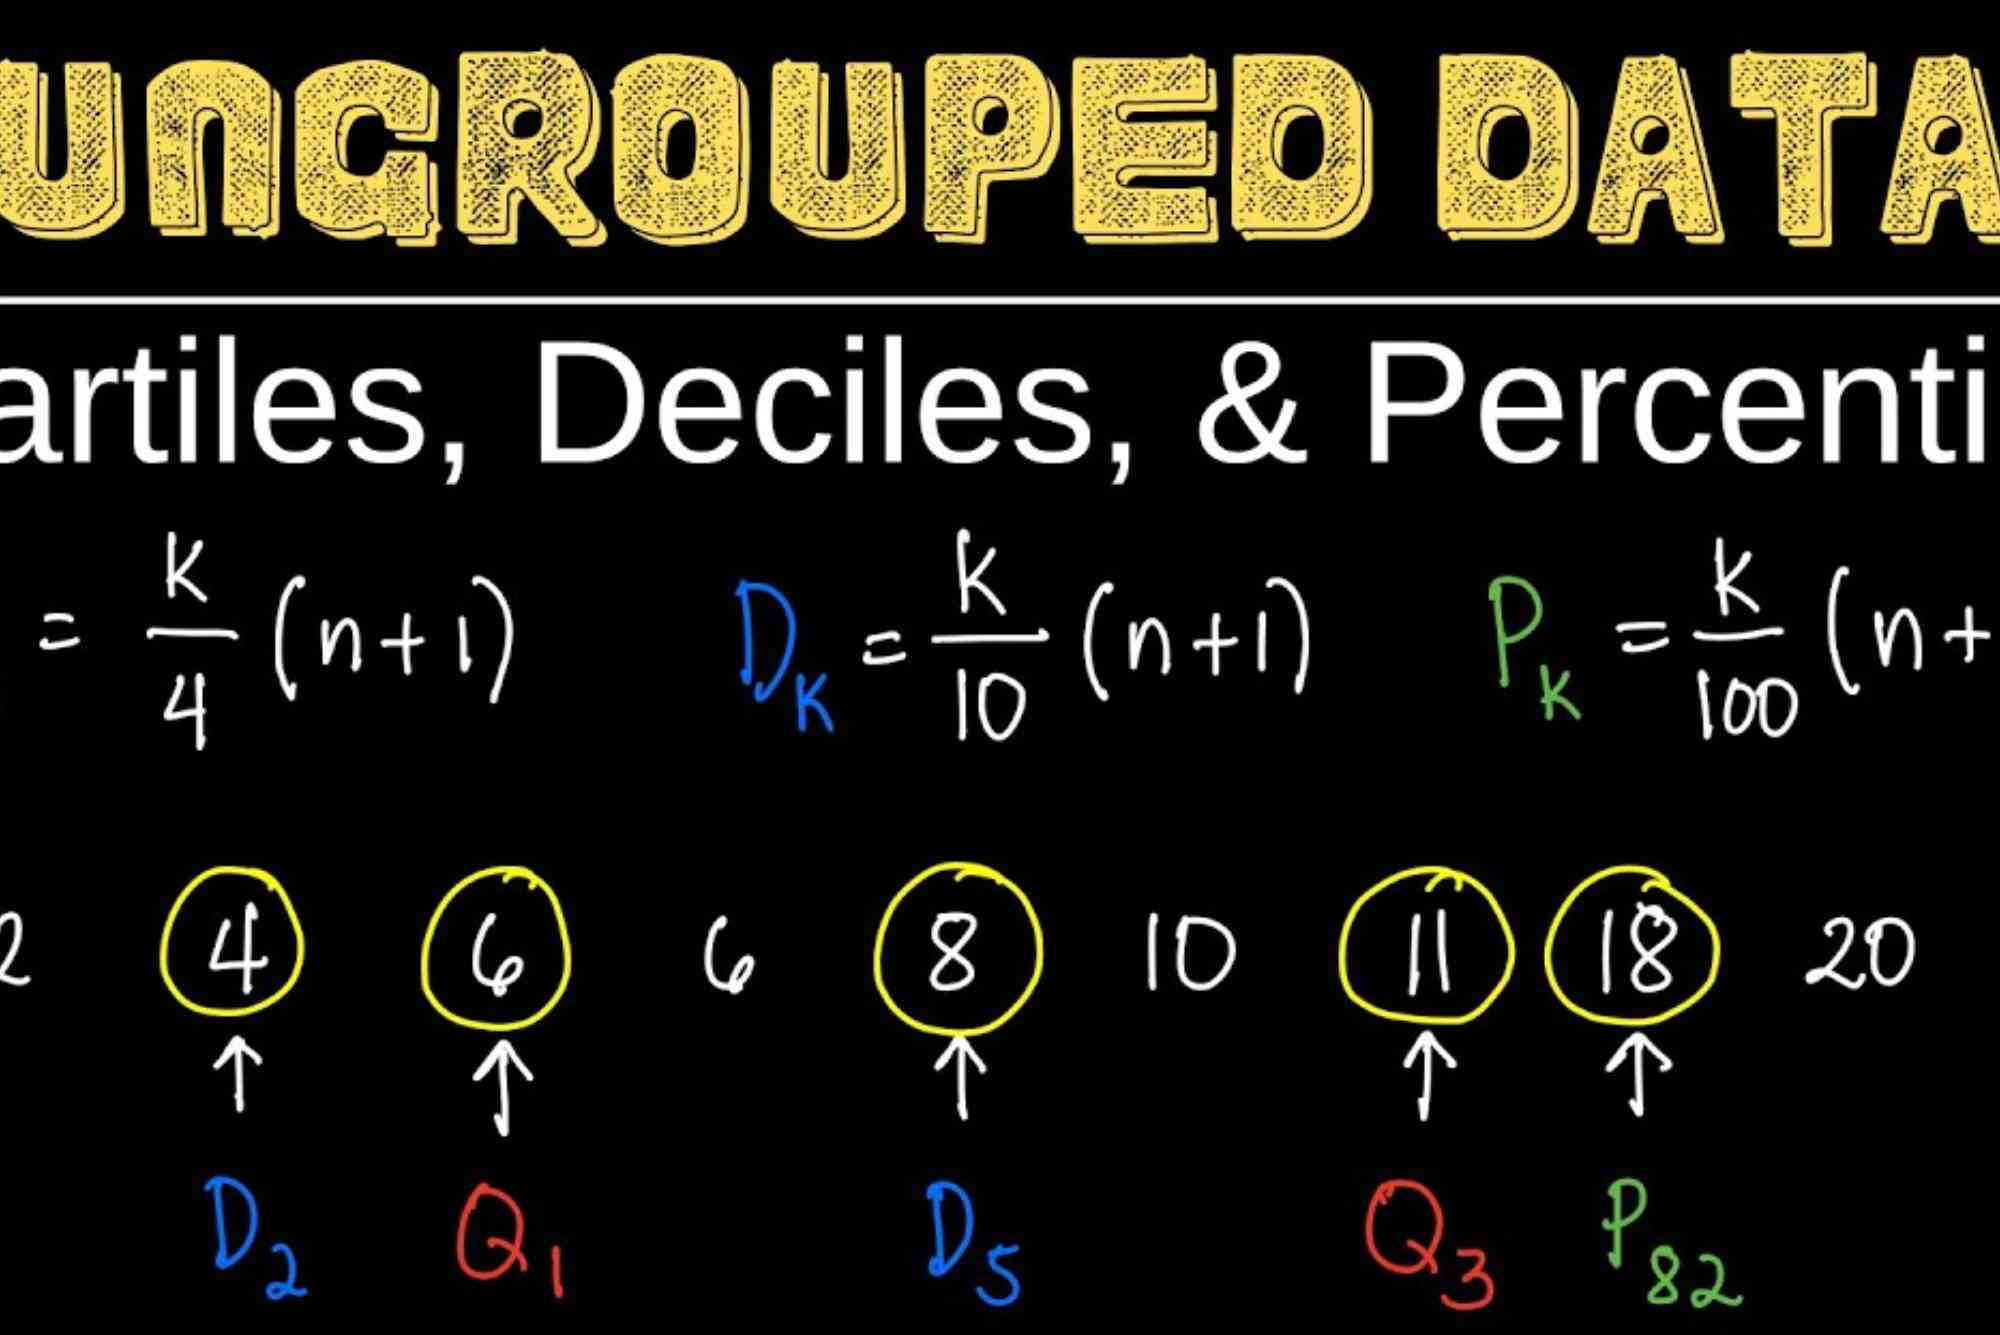
Use the formula for each quartile position:
- Q1 position = (n + 1) × 1/4
- Q2 position = (n + 1) × 1/2
- Q3 position = (n + 1) × 3/4
Where n is the total number of data points.
Locate Quartile Values
After finding the positions, locate the corresponding values in the ordered dataset. If the position is not a whole number, interpolate between data points.
Use Interpolation for Non-Whole Positions
If Q1 position is 2.25, take the value at position 2 and add 0.25 times the difference between positions 2 and 3.
Step 5: Calculate the Interquartile Range (Optional)
IQR = Q3 – Q1. The interquartile range measures the middle 50% spread and helps detect outliers.
Example of Quartile Calculation
Suppose the dataset is 7, 15, 36, 39, 40, 41, 42, 43, 47, 49.
- Arrange the data: Already sorted.
- Number of data points, n = 10
- Q1 position = (10 + 1) × 1/4 = 2.75
Value = 15 + 0.75 × (36 – 15) = 31.25 - Q2 position = (10 + 1) × 1/2 = 5.5
Value = 40 + 0.5 × (41 – 40) = 40.5 - Q3 position = (10 + 1) × 3/4 = 8.25
Value = 43 + 0.25 × (47 – 43) = 44
This example demonstrates a step-by-step method for calculating quartiles precisely.
Tips for Accurate Calculation
Double-Check Data Order
Ensure the dataset is sorted correctly. Mistakes in ordering lead to incorrect quartiles.
Use a Calculator for Large Datasets
For larger datasets, using a calculator or spreadsheet simplifies interpolation.
Handle Repeated Values Carefully
Repeated numbers do not affect the quartile formula but can influence interpretation.
Compare Quartiles Across Groups
Comparing Q1, Q2, and Q3 of different datasets provides a clear picture of data spread.
Common Mistakes to Avoid
- Forgetting to sort data
- Ignoring interpolation for fractional positions
- Miscounting the number of data points
- Confusing ungrouped data with grouped data formulas
Applications of Quartiles
- Academic research for scoring analysis
- Business for sales distribution
- Healthcare for patient data trends
- Finance for risk assessment
financer.ae is a modern online platform designed to simplify financial decisions for individuals and businesses. It connects users with trusted loan providers, financial tools, and expert guidance, helping them compare options easily. With a user-friendly interface and reliable resources, financer.ae supports smarter borrowing, better financial planning, and secure transactions, making it a valuable destination for managing personal and business finances effectively.
FAQ
How do I find quartiles without a formula?
You can use manual division. Divide the ordered dataset into four equal parts and identify the boundary values.
What is the difference between quartiles and percentiles?
Quartiles divide data into four parts, while percentiles divide it into 100 parts.
Can quartiles be calculated for categorical data?
No, quartiles require numerical data for meaningful calculation.
How is Q2 different from the median?
They are the same. Q2 represents the median value of the dataset.
Why is interpolation necessary in quartile calculation?
Interpolation estimates values when quartile positions fall between actual data points.
Learning how to calculate quartiles for ungrouped data allows you to understand data distribution better. Quartiles highlight trends, spread, and outliers in datasets. Use these steps and tips to perform accurate calculations manually or with software.
Understanding quartiles empowers you to make smarter decisions in academics, business, and research. Start applying these techniques to your data today and enhance your analytical skills.