


Introduction
Understanding statistics becomes much easier when you learn how to organize and interpret data. One of the most important concepts in descriptive statistics is quartiles. If you are learning data analysis, you will often come across the need to understand how to find quartiles in ungrouped data.
Ungrouped data refers to raw data that is not organized into classes or intervals. In such cases, finding quartiles helps you divide the data into meaningful parts and understand its distribution. Knowing how to find quartiles in ungrouped data is essential for students, researchers, and anyone working with numerical information.
In this article, we will explore a simple and clear method for how to find quartiles in ungrouped data, along with formulas, examples, and practical explanations.
What Are Quartiles in Statistics?
Before learning how to find quartiles in ungrouped data, it is important to understand what quartiles actually are. Quartiles are values that divide a dataset into four equal parts after arranging it in ascending order.
There are three main quartiles:
The first quartile (Q1) represents the 25th percentile of the data. It shows that 25% of the data falls below this point. The second quartile (Q2), also known as the median, divides the data into two equal halves. The third quartile (Q3) represents the 75th percentile, meaning 75% of the data lies below it.
Understanding these values is the foundation of learning how to find quartiles in ungrouped data effectively.
Understanding Ungrouped Data
To master how to find quartiles in ungrouped data, you must first understand the nature of ungrouped data. Ungrouped data is simply a collection of raw numbers that are not arranged into frequency tables or class intervals.
For example, test scores of students like 45, 60, 75, 80, and 90 represent ungrouped data. Since the data is not grouped, we directly use mathematical formulas and positional methods to find quartiles.
The process of how to find quartiles in ungrouped data is straightforward when the data is arranged in ascending order.
Steps on How to Find Quartiles in Ungrouped Data
When learning how to find quartiles in ungrouped data, the process follows a clear sequence. First, arrange the data in ascending order. This step is crucial because quartiles depend on the ordered position of values.
Next, determine the total number of observations in the dataset. Let this be represented as “n.” Once the data is sorted, apply the formulas to locate Q1, Q2, and Q3.
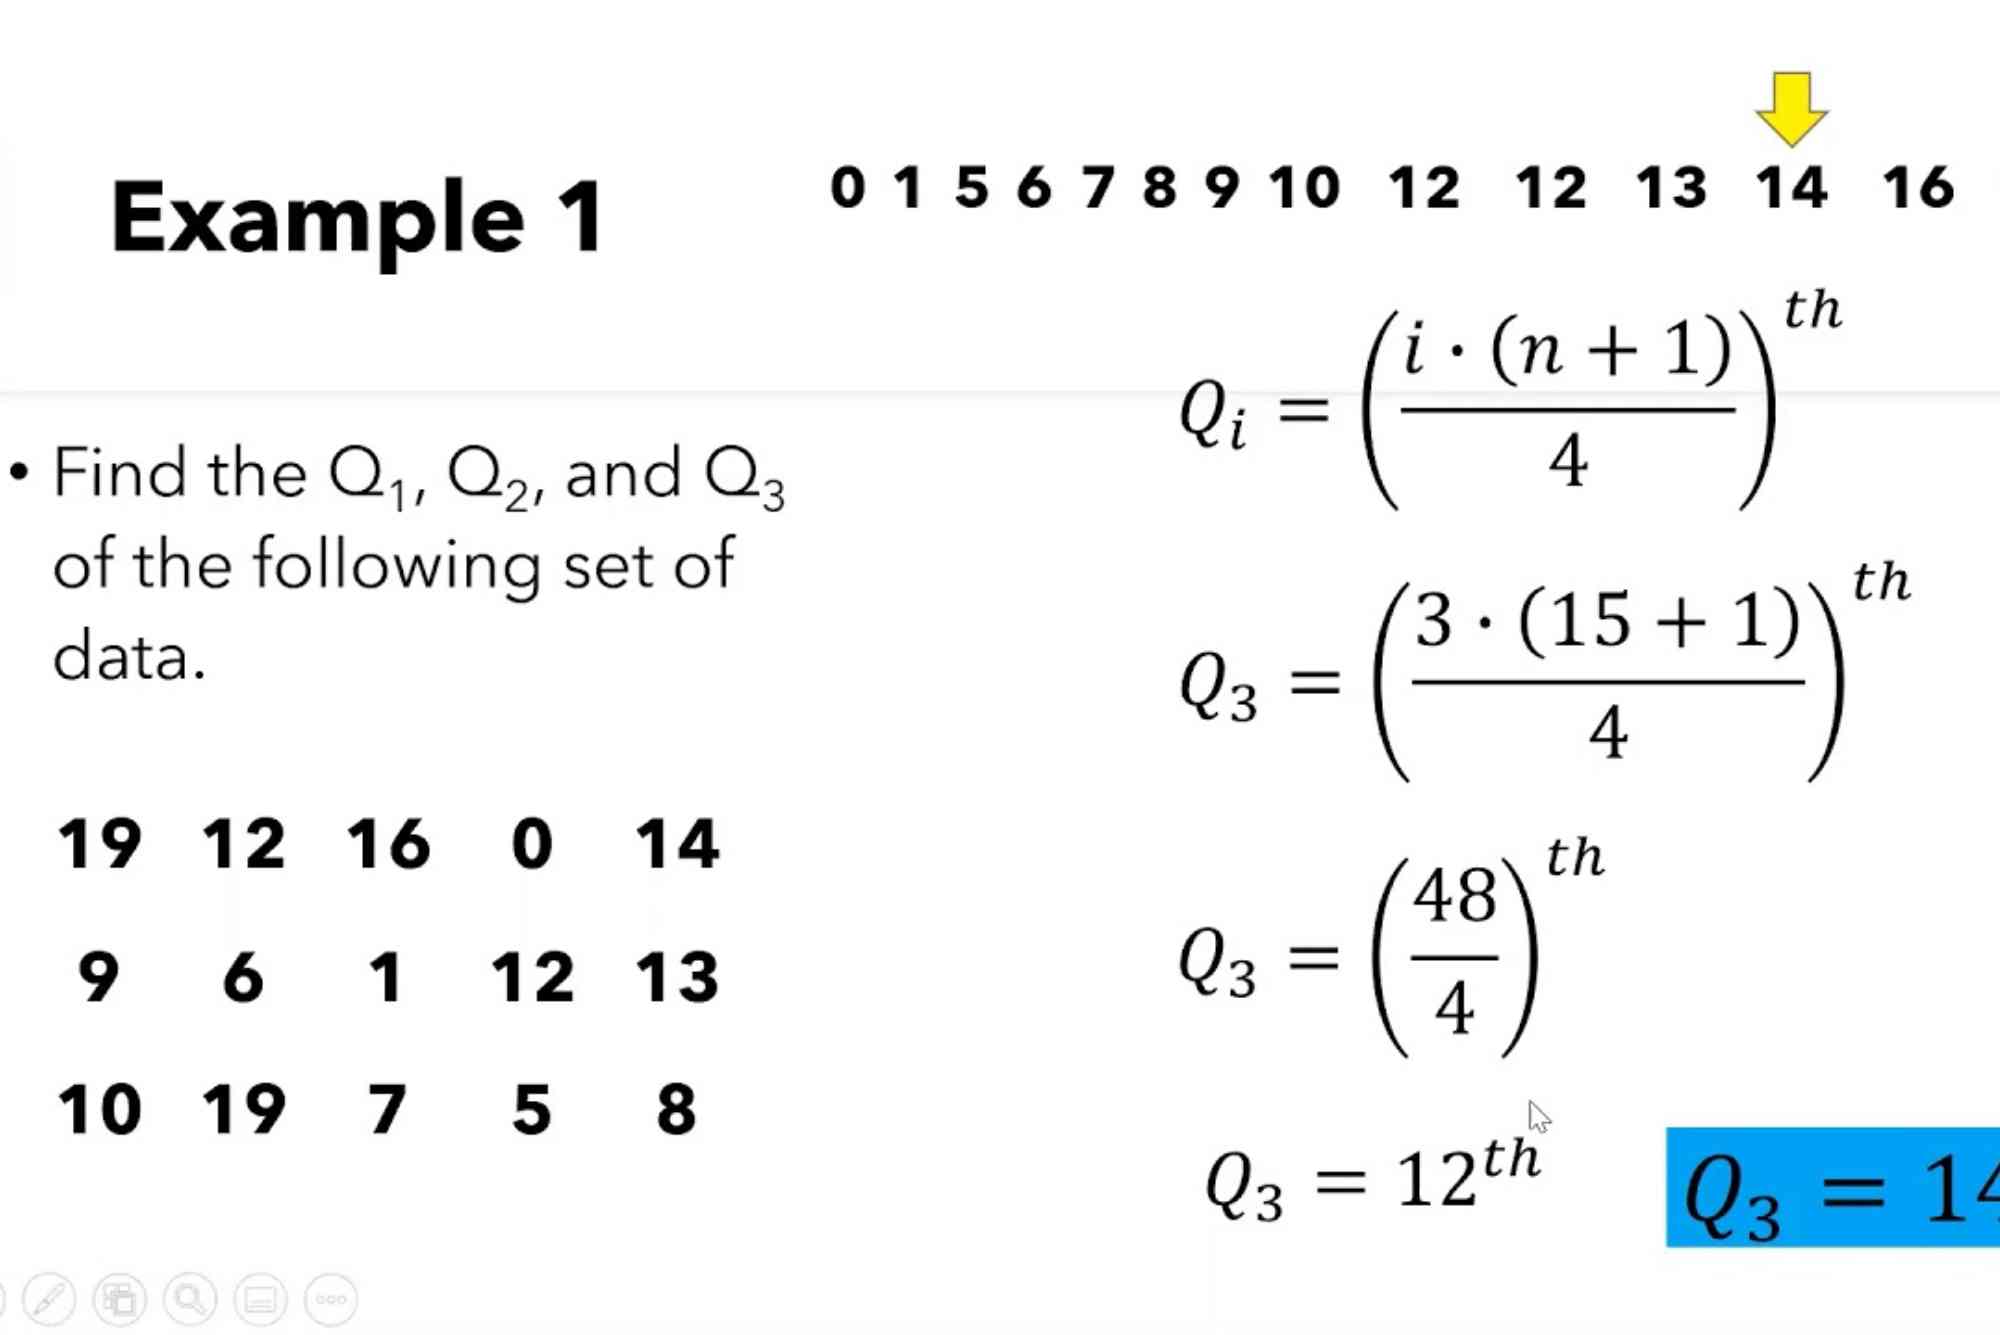
For Q1, use the position formula (n + 1) divided by 4. For Q2, which is the median, use (n + 1) divided by 2. For Q3, use 3(n + 1) divided by 4.
These formulas are essential in understanding how to find quartiles in ungrouped data correctly.
After finding the positions, identify the corresponding values in the dataset. If the position is not a whole number, interpolation may be required.
Formulas Used in Finding Quartiles
The formula-based approach is the backbone of how to find quartiles in ungrouped data. These formulas help determine the exact position of each quartile in the dataset.
For the first quartile, Q1 = value at position (n + 1) / 4
For the second quartile, Q2 = value at position (n + 1) / 2
For the third quartile, Q3 = value at position 3(n + 1) / 4
These expressions allow us to calculate quartiles systematically. When you understand these formulas, learning how to find quartiles in ungrouped data becomes much simpler.
Example of Finding Quartiles in Ungrouped Data
Let us understand how to find quartiles in ungrouped data with a simple example.
Suppose we have the following dataset: 12, 15, 18, 20, 25, 30, 35, 40, 45.
First, arrange the data in ascending order, which is already done here. The total number of observations is 9.
Now we calculate positions for quartiles.
For Q1, position is (9 + 1) / 4 = 2.5
For Q2, position is (9 + 1) / 2 = 5
For Q3, position is 3(9 + 1) / 4 = 7.5
Now identify the values:
Q1 lies between 15 and 18, so it becomes 16.5 after interpolation.
Q2 is the 5th value, which is 25.
Q3 lies between 35 and 40, so it becomes 37.5.
This example clearly shows how to find quartiles in ungrouped data step by step.
Importance of Quartiles in Data Analysis
Learning how to find quartiles in ungrouped data is not just an academic exercise. It has real-world applications in data analysis, business, and research.
Quartiles help in understanding data distribution and identifying outliers. They also assist in comparing datasets and measuring variability. In fields like economics and education, quartiles are widely used to analyze performance and trends.
When you understand how to find quartiles in ungrouped data, you gain a powerful tool for interpreting numerical information effectively.
Common Mistakes to Avoid
Many students face difficulties when learning how to find quartiles in ungrouped data. One common mistake is not arranging data in ascending order. This leads to incorrect results.
Another mistake is miscalculating the position of quartiles. It is important to carefully apply formulas and check calculations.
Also, forgetting interpolation when needed can affect accuracy. Avoiding these mistakes will make your understanding of how to find quartiles in ungrouped data much stronger.
Applications of Quartiles in Real Life
The concept of how to find quartiles in ungrouped data is widely used in real-world situations. In education, teachers use quartiles to evaluate student performance. In business, they help analyze sales data and customer behavior.
In healthcare, quartiles are used to study patient data distribution. Financial analysts use them to assess investment returns and risks.
These applications show why learning how to find quartiles in ungrouped data is valuable beyond the classroom.
Conclusion
Understanding how to find quartiles in ungrouped data is a key skill in statistics. It helps you break down raw data into meaningful parts and improves your analytical thinking.
By learning the formulas, practicing examples, and avoiding common mistakes, you can master how to find quartiles in ungrouped data with ease.
If you want to improve your statistics skills further, start practicing with real datasets today. The more you apply these concepts, the more confident you will become in data analysis.
(FAQs)
What is the easiest way to find quartiles in ungrouped data?
The easiest way is to arrange the data in order and use position formulas to locate Q1, Q2, and Q3.
Why do we calculate quartiles in statistics?
We calculate quartiles to understand data distribution and divide data into equal parts for better analysis.
Can quartiles be calculated without grouping data?
Yes, learning how to find quartiles in ungrouped data allows you to calculate them directly from raw data using formulas.
What is the difference between median and quartiles?
The median is Q2, which divides data into two equal parts, while quartiles divide data into four equal parts.
Is interpolation always required in quartiles?
Interpolation is only required when the quartile position is not a whole number.
Where is quartile analysis used in real life?
Quartile analysis is used in education, business, healthcare, and financial studies for data interpretation.
Calculate Weighted Distribution is a method used to calculate the average or impact of values based on their importance. To calculate it, multiply each value by its assigned weight, then add the results together. Finally, divide the total weighted value by the sum of all weights. This approach is commonly used in statistics, marketing, and finance to get more accurate results where not all factors are equal. Understanding weighted distribution helps in making fair comparisons when different items carry different significance. It improves decision-making accuracy.